Metrics Dashboard
The Konstellation Dashboard is your command center for maintaining and improving data reliability across your organization. Here’s what you can expect:
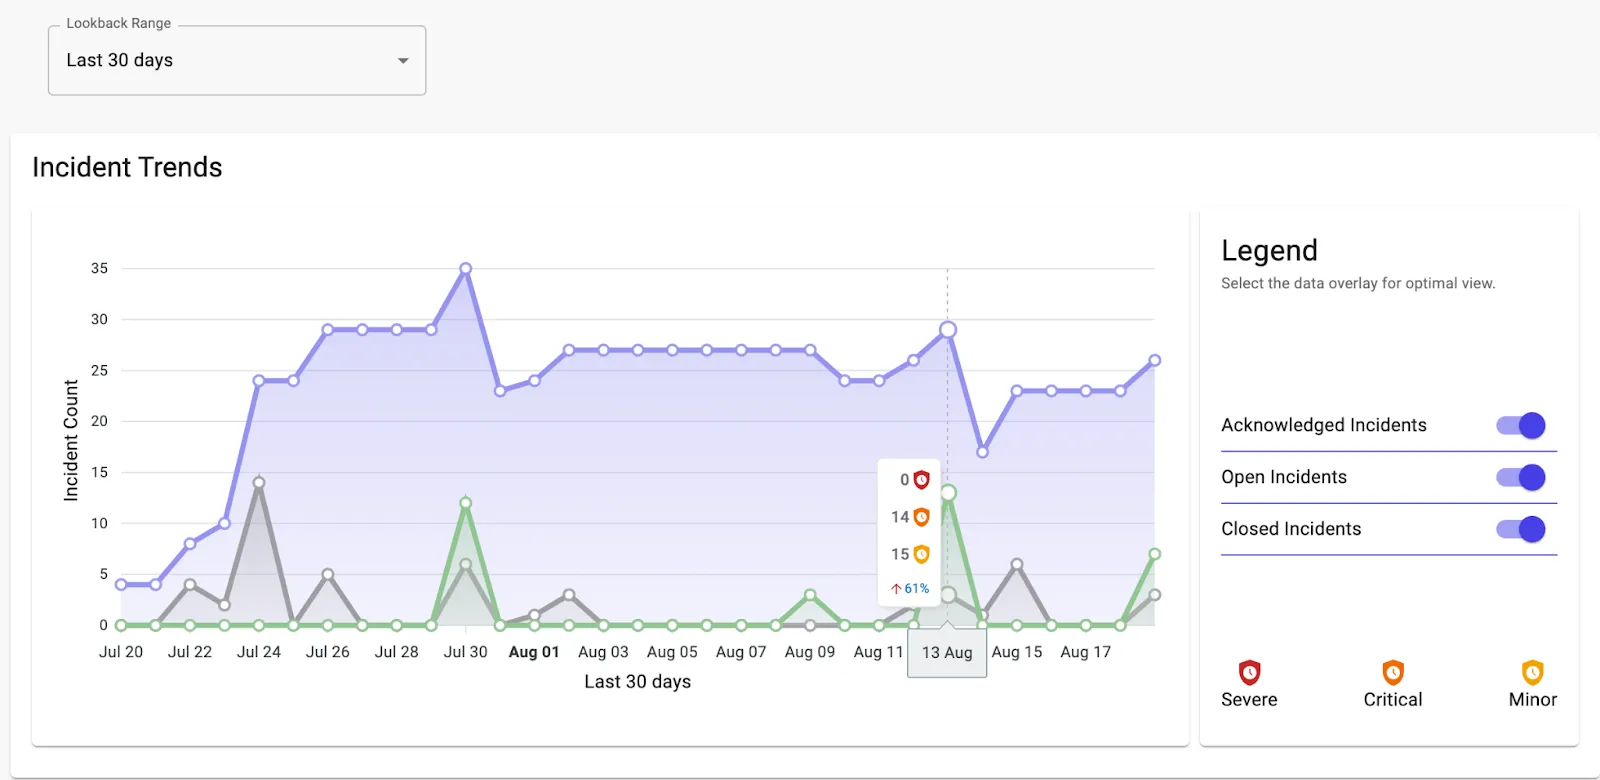
Incident Metrics
Stay informed with real-time metrics on incidents across your data ecosystem. The dashboard provides an at-a-glance summary of:
- Detected Incidents: Total number of incidents identified by Konstellation.
- Acknowledged Incidents: Incidents that have been reviewed and acknowledged by your team.
- Closed Incidents: Successfully resolved incidents, helping you track progress over time.
Resolution Patterns & Backlog Management
Understand how your team is performing in incident management. The dashboard displays overall metrics to:
- Track the speed and efficiency of incident resolution.
- Identify any backlog of unresolved incidents that need attention.
- Analyze patterns in incident resolution to optimize team workflows and improve response times.
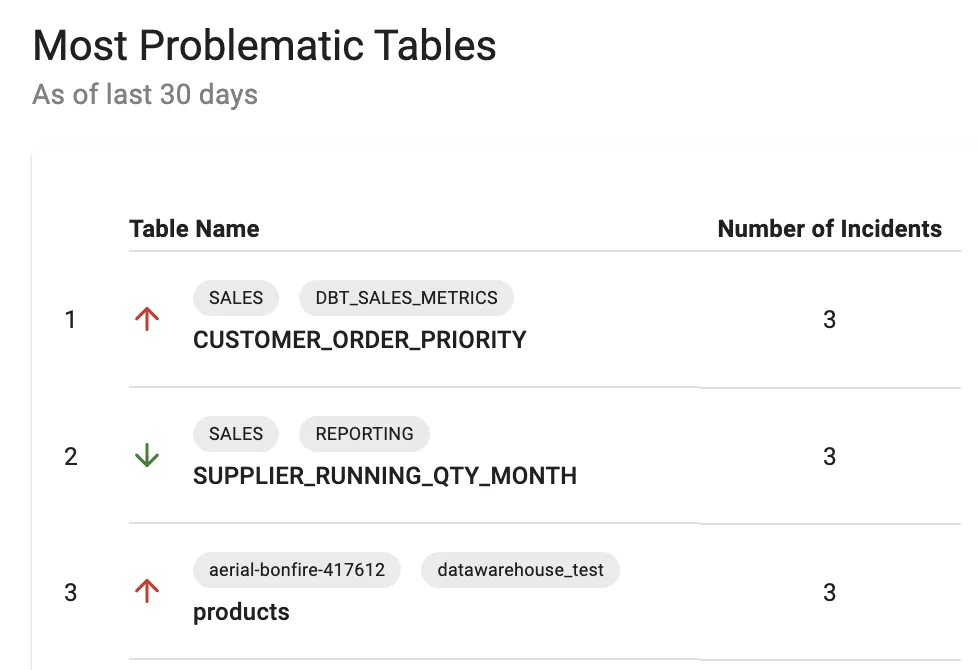
Most Problematic Tables
Identify and diagnose tables that consistently cause issues. This section of the dashboard highlights:
-
High-Failure Tables: Tables that frequently experience incidents, signaling a need for deeper analysis or different handling strategies.
-
Diagnostics Tools: Direct access to tools and insights to investigate and address the root causes of repeated failures.