Table Metrics
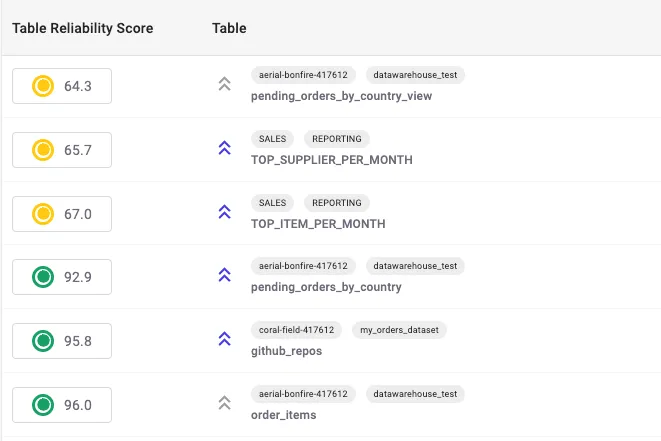
In the Tables page, you will find a list of all your tables, together with their Table Reliability Score for the day. These are by default sorted by the lowest Table Reliability Score so that you can pay attention to what matters most. Separately, use the filters at the top to find the tables you are interested in.
In the following guide you will find all the information that is available in the Tables page.
Table Reliability Score
Konstellation brings all tables from all your integrated data sources under a single view, with our standardized Table Reliability Score. This comprehensive score reflects the reliability of each table based on various metrics like data freshness, volume consistency, and column statistics. The Table Reliability Score helps prioritize which tables need attention, ensuring that your most critical data assets are always in top shape.
Table Reliability Scores are updated as your data refreshes, and provide you a one-stop shop to understand Reliability of your data assets.
Volume
Our ML-algorithms monitor the total number of records/rows in your tables over time in order to learn normal data growth patterns for each of your tables, identify unusual spikes, and ensure that data pipelines are loading the expected volume of data. Whenever anomalies are detected, this will be visible in the table page as well as it will impact the corresponding Table Reliability Score. There’s no configuration needed, this is monitored out-of-the-box
Landing Time
Konstellation automatically monitors the time when data lands in your tables and through our ML-models, understands the refresh pattern for each of your tables. Konstellation establishes an SLA per table, indicating the time that data is usually expected and monitors against this to ensure timeliness. This ensures that data arrives within expected time windows, helping you identify delays in data ingestion that could impact downstream processes. There’s no configuration needed, this is monitored out-of-the-box
Column Stats
Konstellation analyzes key statistics for each column in your tables, such as minimum, maximum, and percent of null values. These Stats provide insights into the distribution of your data, helping to detect anomalies like unexpected nulls or outliers. There’s no configuration needed, this is monitored out-of-the-box
Optional Configurations
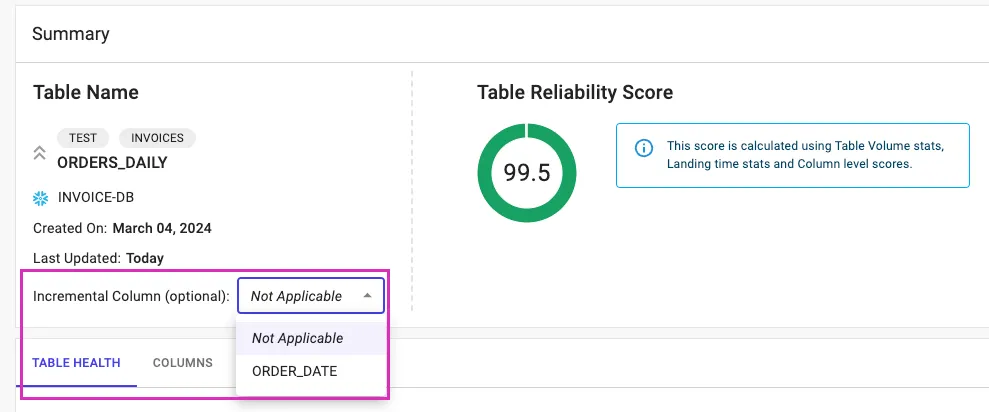
Incremental Column
Konstellation has the ability to monitor tables that receive incremental updates, such as a daily sales table. This metric is crucial for understanding how new data is being appended and whether any expected increments are missing or incorrect. For tables that load incrementally, you can specify the Incremental Date/Timestamp Column in the table detail page to make the monitoring more precise. If you avoid doing it, Konstellation will always look at the complete data set, instead of the new data.
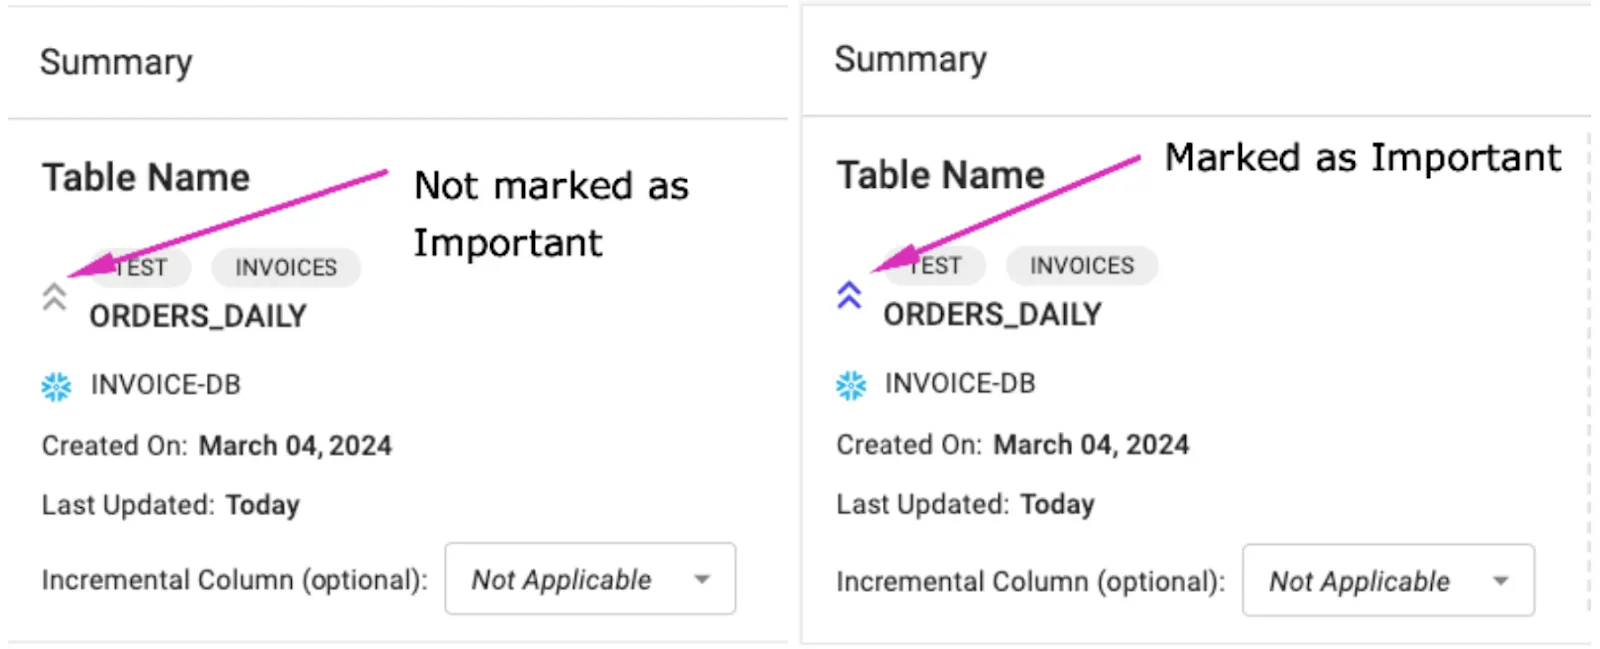
Important Tables
Identify and flag critical tables in your data ecosystem. Important Tables are those that directly impact business decisions, making it essential to monitor them closely for data quality and reliability. To do this, you can highlight the table as Important either on the Tables page or on the Table Detail page. Boosting the importance of a Table not only helps with your own discoverability but also impacts our prioritization algorithm as part of Criticality Score. Whenever alerts have an Important Table as the origin of the alert or in the impacted workflow, the Criticality Score will be higher, so your team can act more urgently.