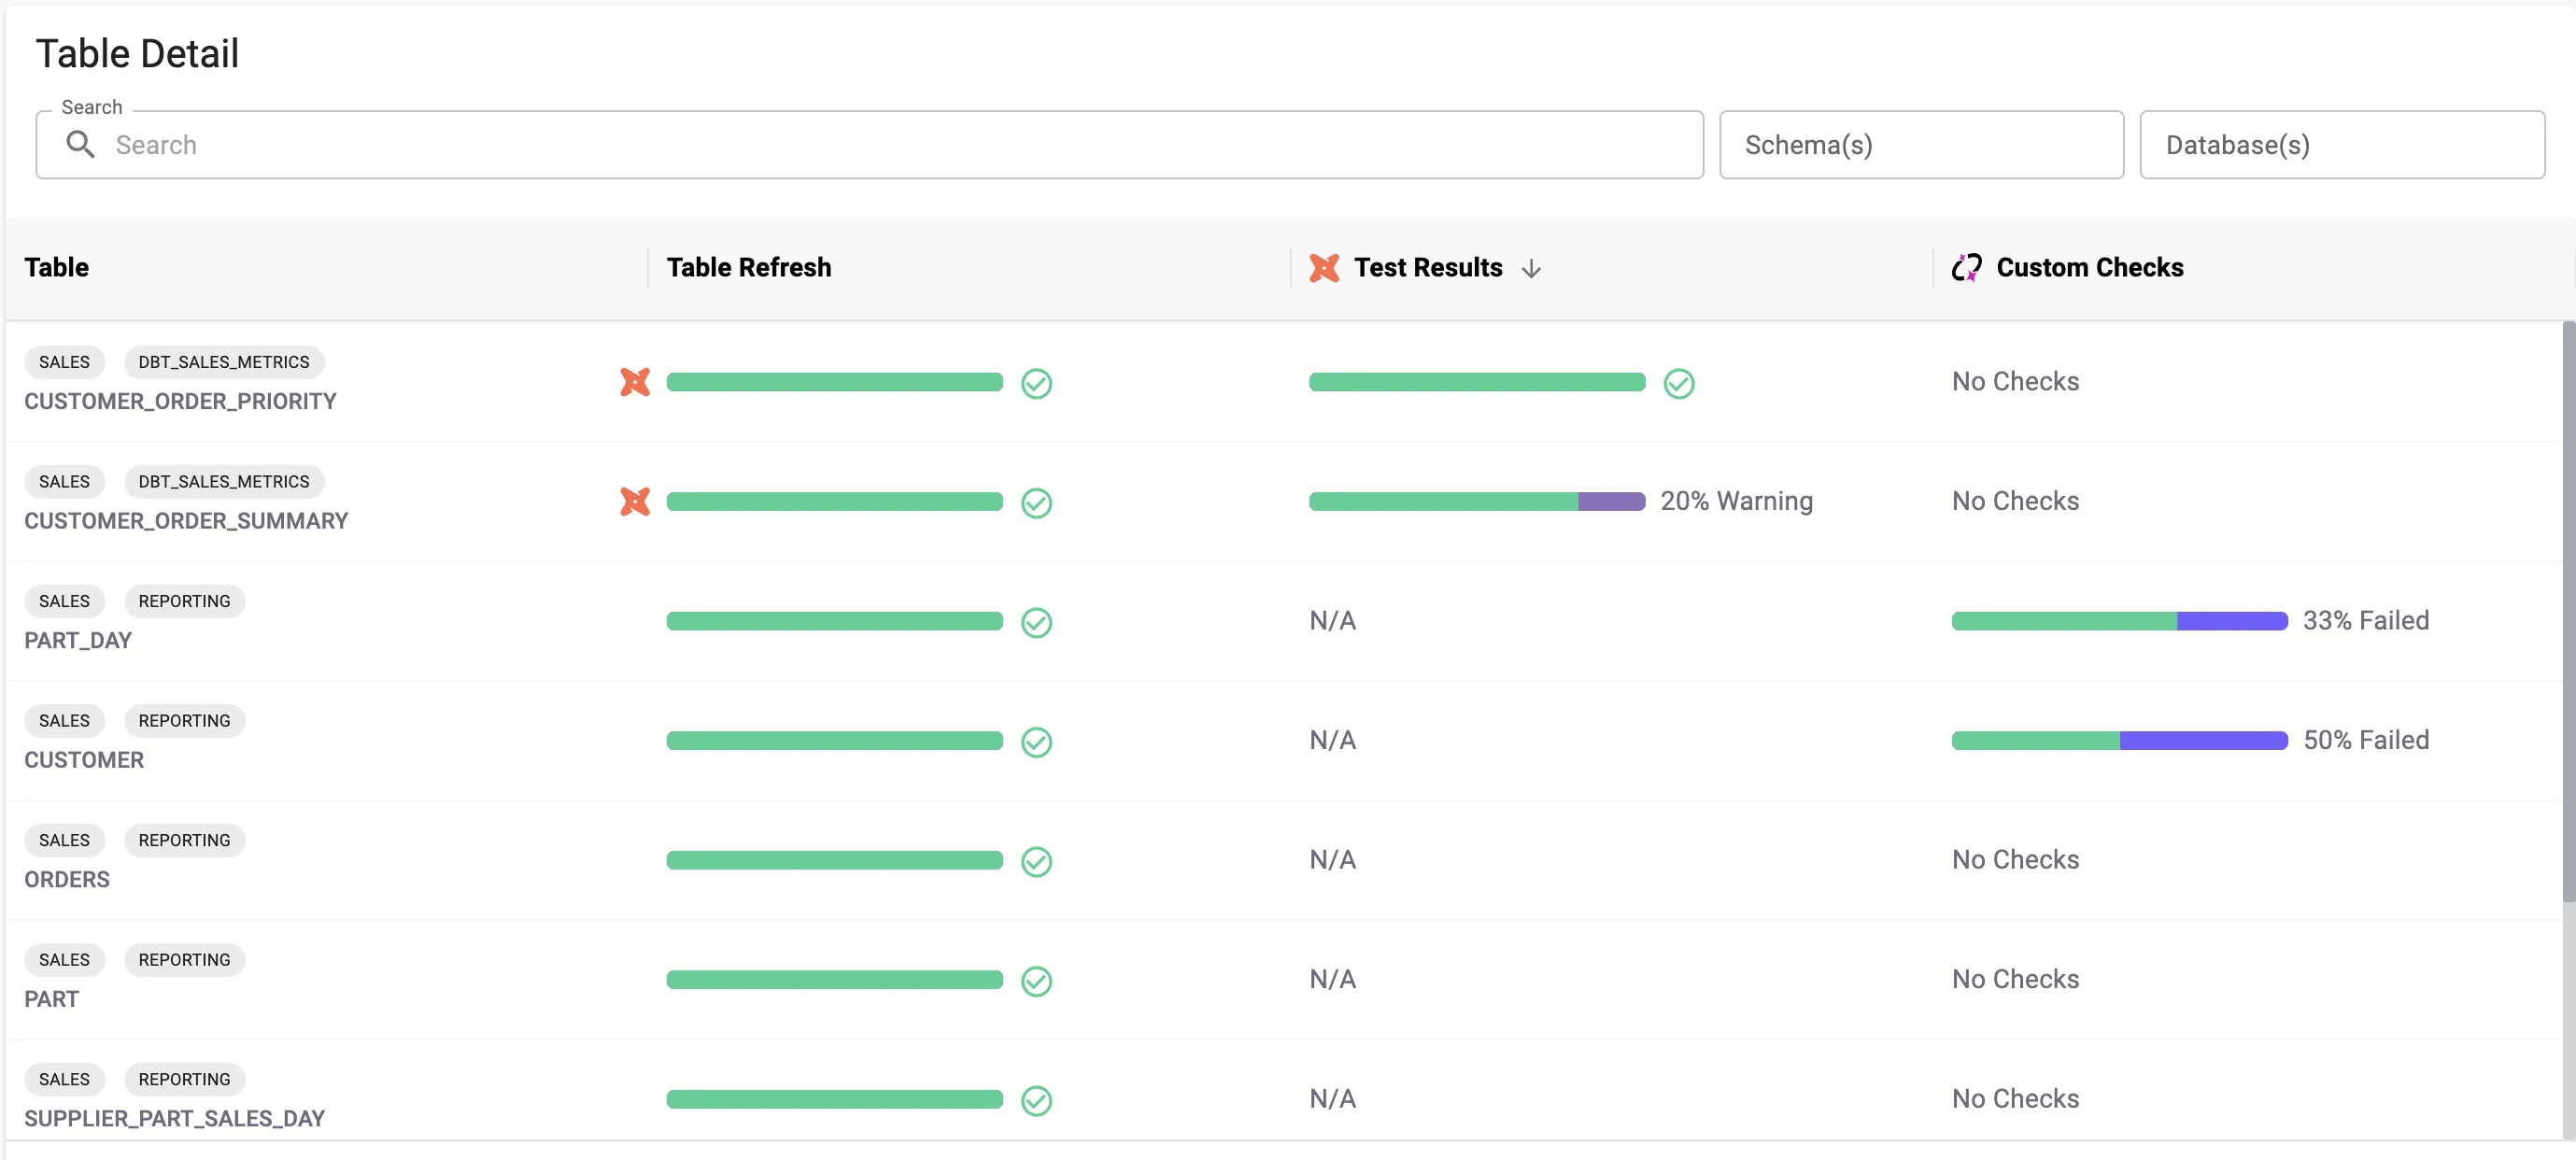
Reliability Insights
Reliability Insights is your daily go-to dashboard for understanding the status and reliability of table refreshes across your entire data environment. This dashboard empowers you to monitor, diagnose, and act on data reliability issues, ensuring your workflows remain consistent and trustworthy each day.
When to use?
- Real-time Monitoring: Continuously track the health of your data environment and address issues as they arise.
- Performance Optimization: Leverage reliability insights to prioritize fixes that enhance the stability and dependability of your data processes.
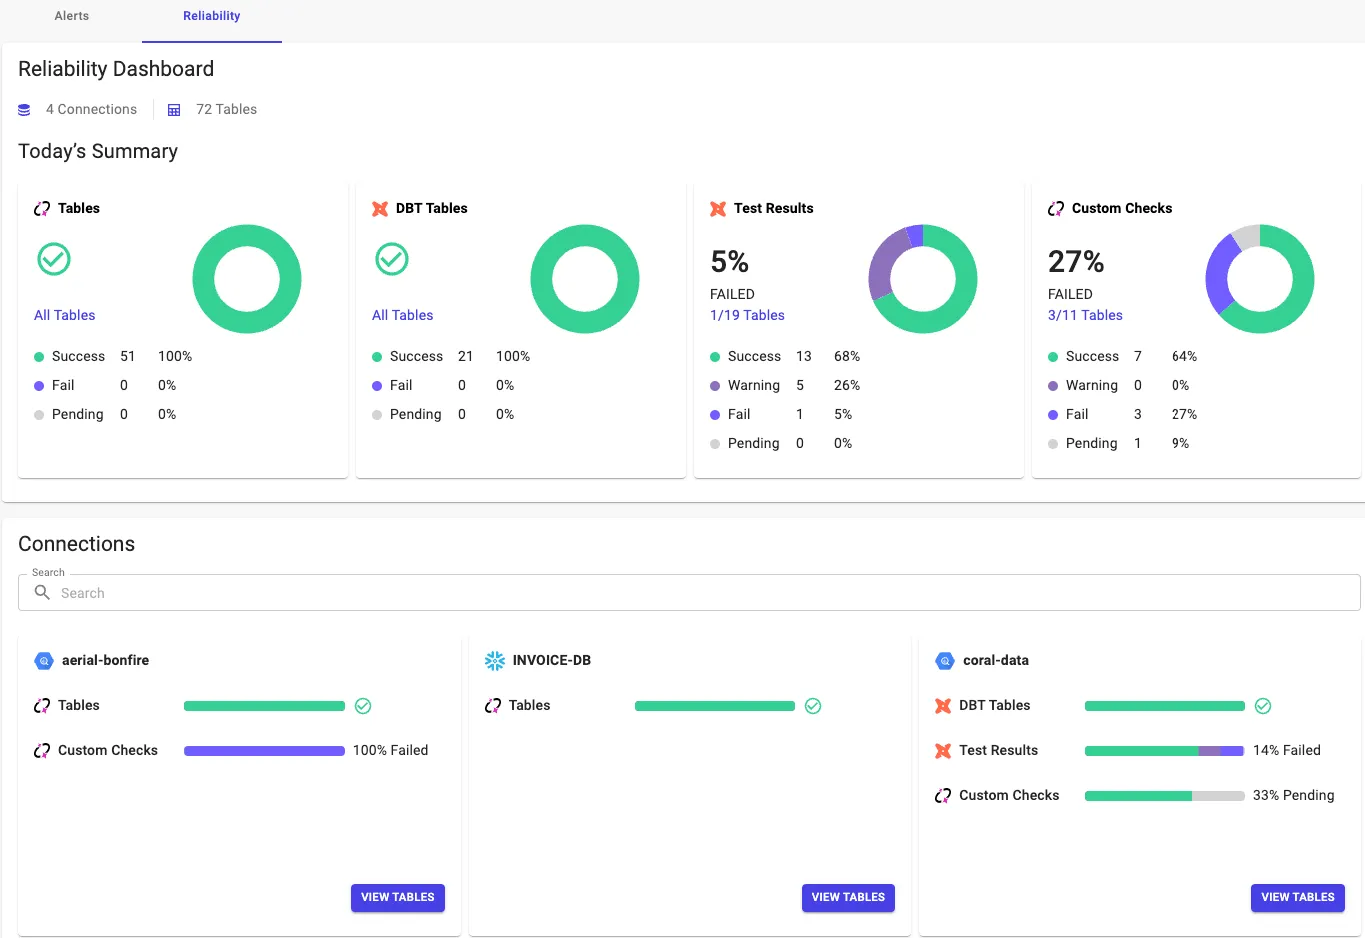
Today’s Summary Overview
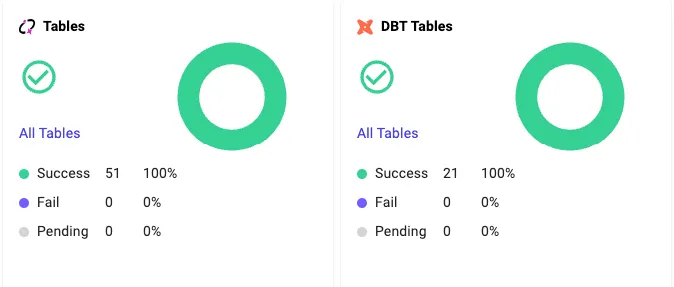
1. Tables Status and DBT Status: View the performance status of all your tables across all data sources at a glance.
| Note: If DBT is enabled in your environment, dbt-managed tables will be shown separately. |
- Table Breakdown Status:
- Success: Total number of tables processed or refreshed successfully, based on automatically learning which tables are expected to load each day.
- Fail: Number of tables that encountered issues or did not refresh.
- Pending: Tables that are awaiting processing for the day.
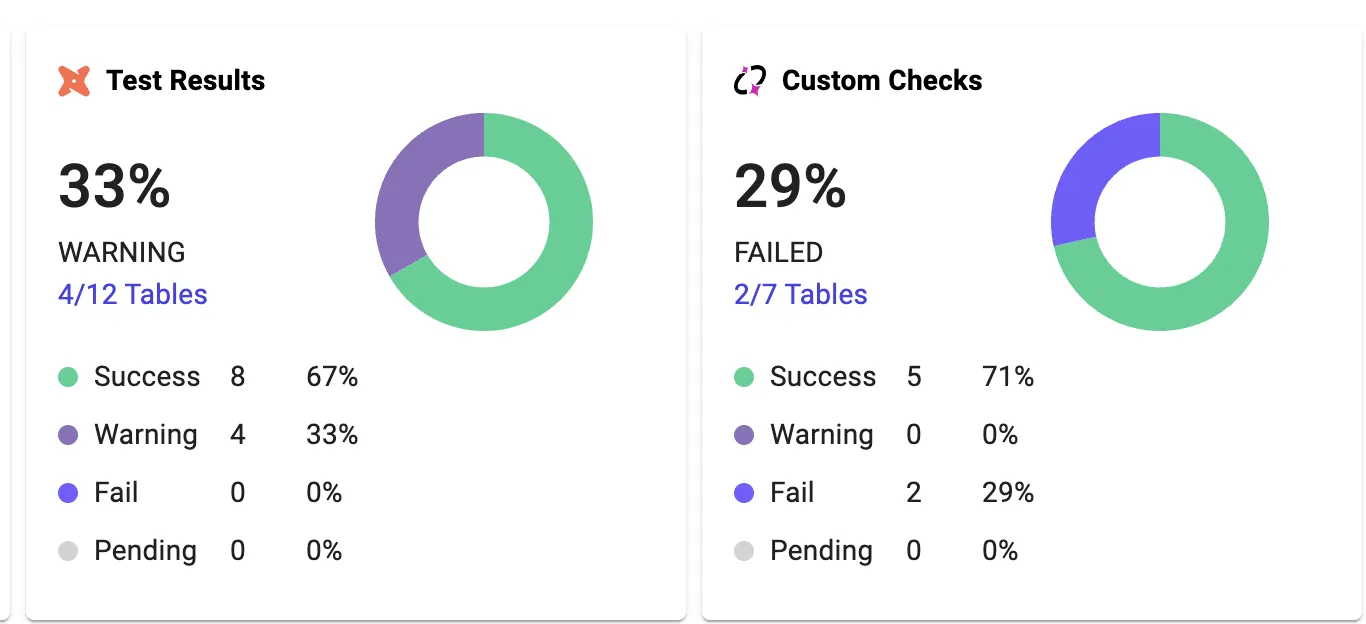
2. Custom Checks and DBT Tests Status: Understand the outcome of custom checks and DBT tests for your tables, allowing you to quickly see if all checks have passed.
| Note: If DBT is enabled, results for dbt tests will be displayed separately. |
- Table Breakdown Status:
- Success: Number of tables that passed all checks/tests.
- Warning: Number of tables with at least one DBT test failure.
- Fail: Number of tables with at least one custom check failure.
- Pending: Tables pending refresh for the day (checks/tests have not yet run).
Connection-Level Reliability
To facilitate troubleshooting, the dashboard offers a breakdown of metrics for each data connection, helping ensure that all data sources remain synchronized and reliable.
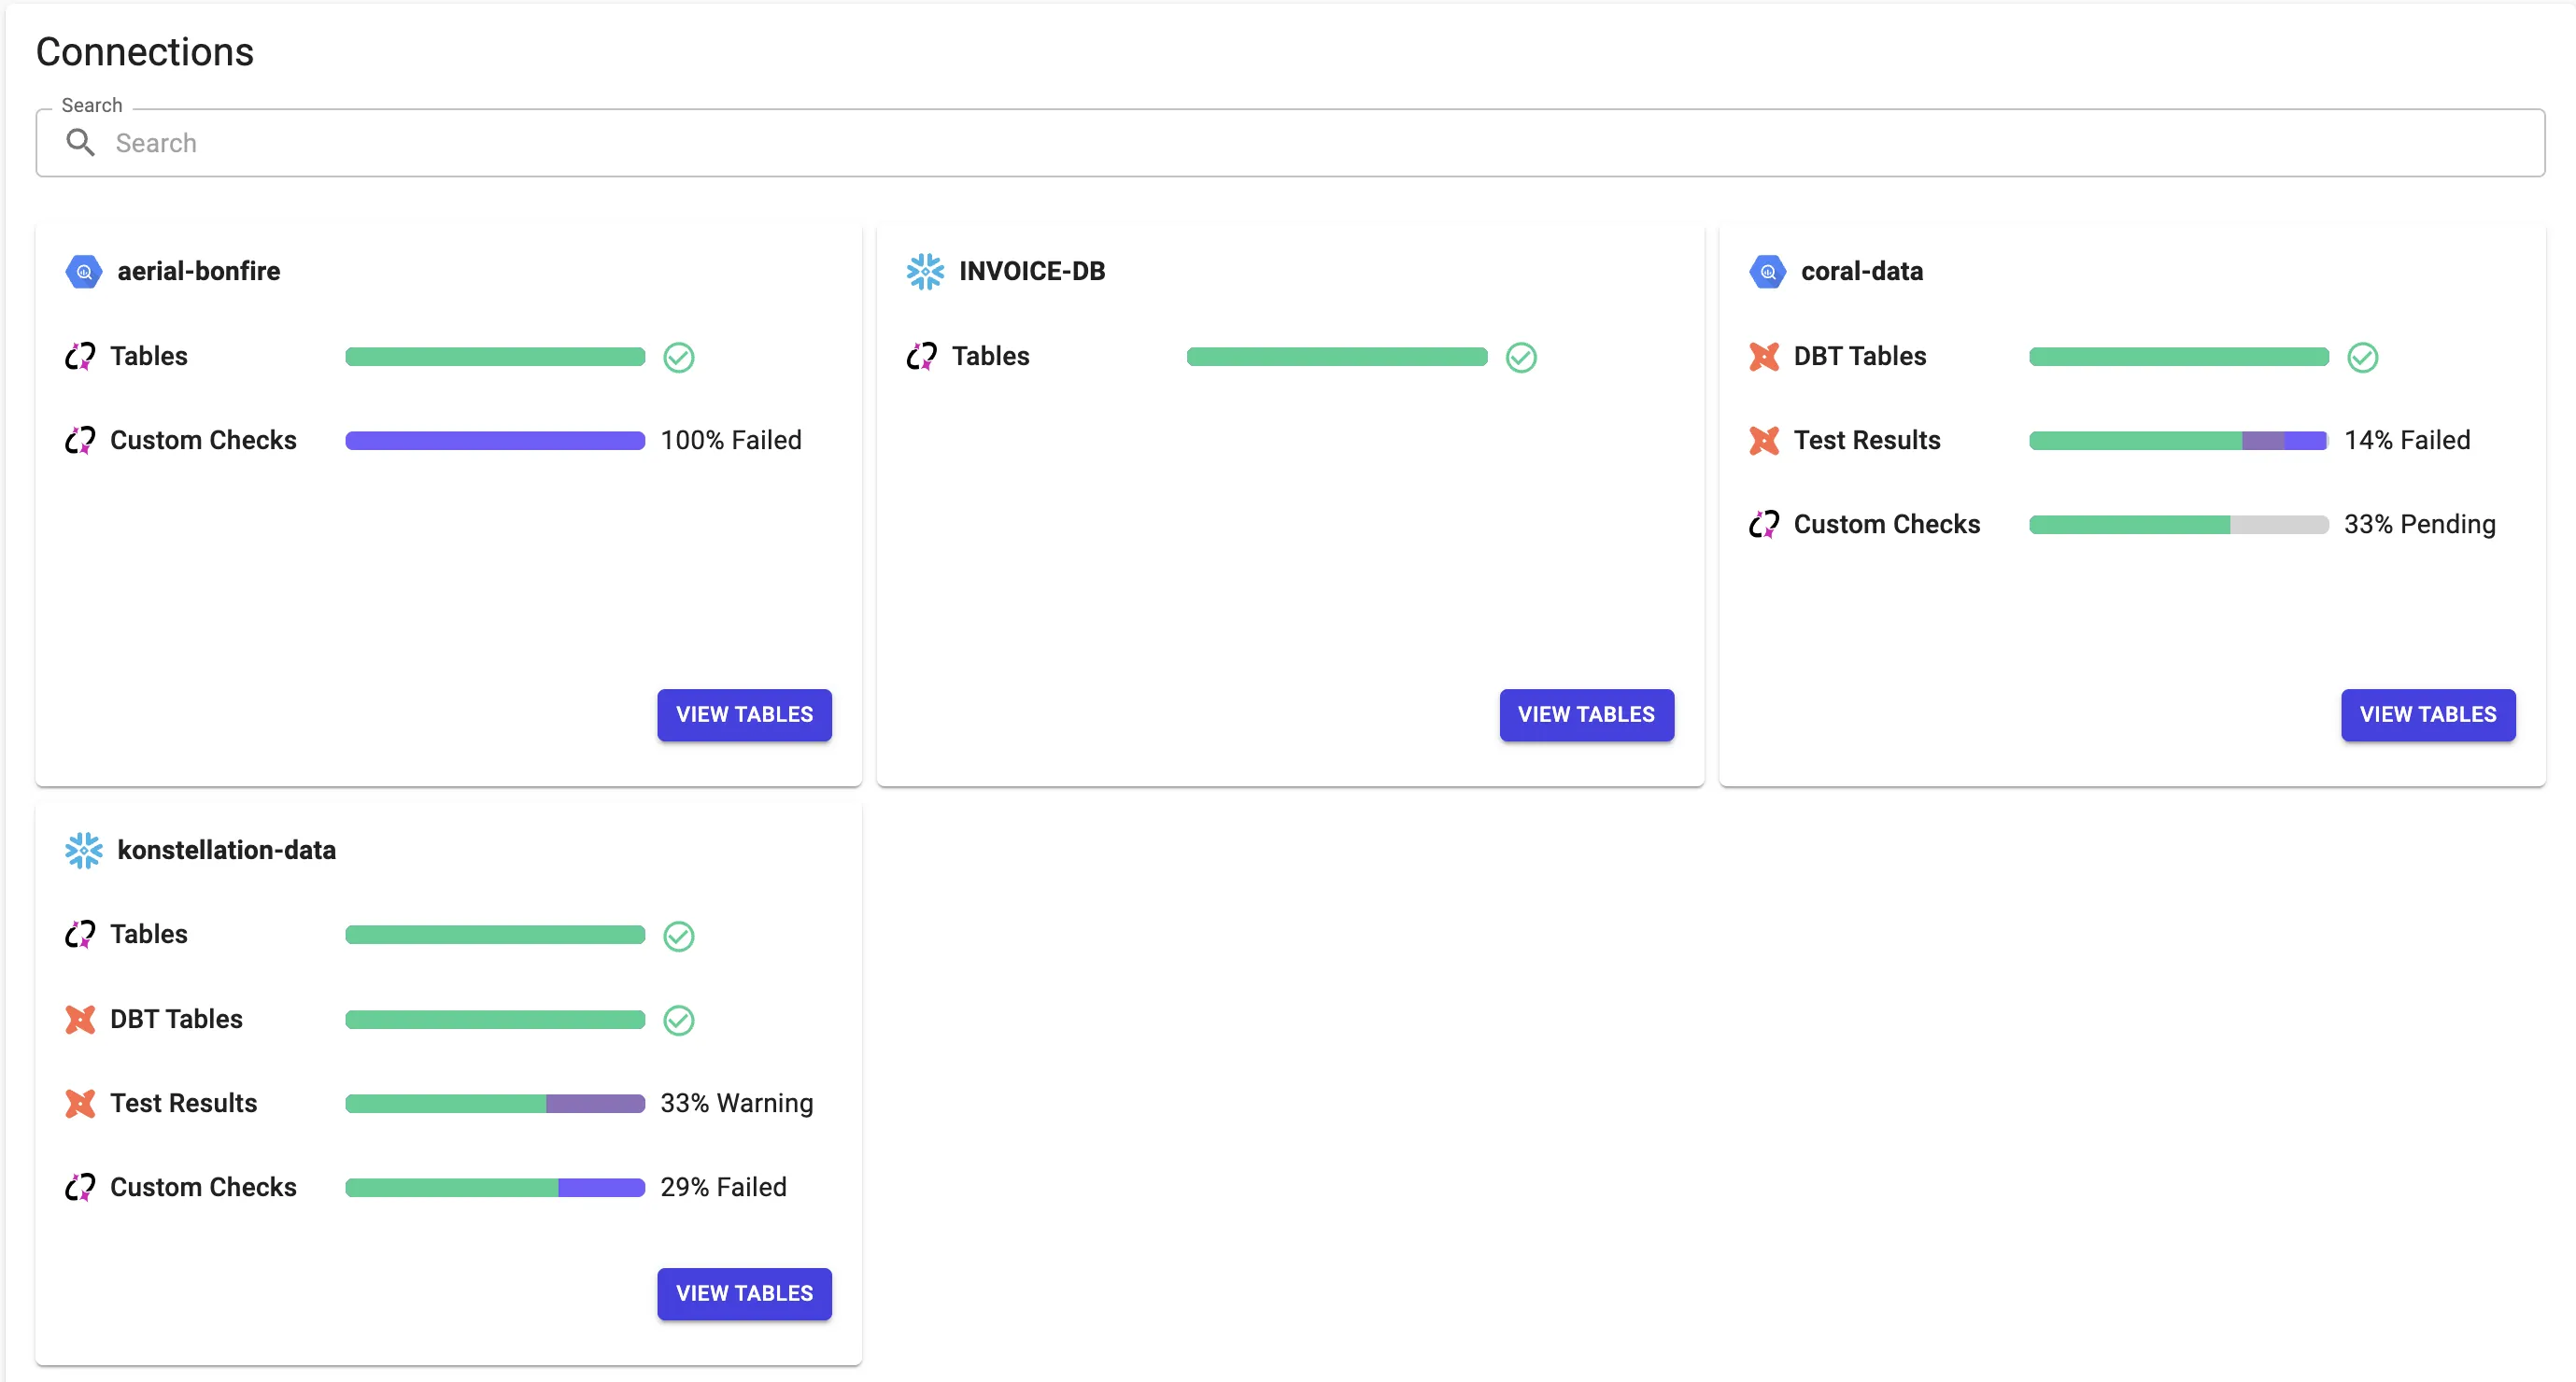
- Connection-Level Insights: Each connection page includes a detailed list of tables and their corresponding issues, enabling comprehensive diagnostics for specific tables with the same metrics:
- Success and failure rates.
- Status of test results, including custom checks.
- Direct navigation to individual table detail pages for deeper analysis.
